Note
Click here to download the full example code
Pairwise functional alignment
In this tutorial, we show how to better predict new contrasts for a target subject using source subject corresponding contrasts and data in common.
We mostly rely on python common packages and on nilearn to handle functional data in a clean fashion.
To run this example, you must launch IPython via ipython
--matplotlib in a terminal, or use jupyter-notebook.
Retrieve the data
In this example we use the IBC dataset, which include a large number of different contrasts maps for 12 subjects. We download the images for subjects sub-01 and sub-02 (or retrieve them if they were already downloaded) Files is the list of paths for each subjects. df is a dataframe with metadata about each of them. mask is an appropriate nifti image to select the data.
from fmralign.fetch_example_data import fetch_ibc_subjects_contrasts
files, df, mask = fetch_ibc_subjects_contrasts(
    ['sub-01', 'sub-02'])
Define a masker
- We define a nilearn masker that will be used to handle relevant data.
For more information, visit : ‘http://nilearn.github.io/manipulating_images/masker_objects.html’
from nilearn.input_data import NiftiMasker
masker = NiftiMasker(mask_img=mask)
mask
masker.fit()
- Prepare the data
- For each subject, for each task and conditions, our dataset contains two
independent acquisitions, similar except for one acquisition parameter, the encoding phase used that was either Antero-Posterior (AP) or Postero-Anterior (PA).
Although this induces small differences in the final data, we will take
- advantage of these “duplicates to create a training and a testing set that
contains roughly the same signals but acquired totally independently.
# The training fold, used to learn alignment from source subject toward target:
# * source train: AP contrasts for subject sub-01
# * target train: AP contrasts for subject sub-02

source_train = df[df.subject == 'sub-01'][df.acquisition == 'ap'].path.values
target_train = df[df.subject == 'sub-02'][df.acquisition == 'ap'].path.values

# The testing fold:
# * source test: PA contrasts for subject sub-01, used to predict
#   the corresponding contrasts of subject sub-02
# * target test: PA contrasts for subject sub-02, used as a ground truth
#   to score our predictions

source_test = df[df.subject == 'sub-01'][df.acquisition == 'pa'].path.values
target_test = df[df.subject == 'sub-02'][df.acquisition == 'pa'].path.values
Out:
/Users/thomasbazeille/Documents/Stage/fmralign/examples/plot_pairwise_alignment.py:64: UserWarning: Boolean Series key will be reindexed to match DataFrame index.
  source_train = df[df.subject == 'sub-01'][df.acquisition == 'ap'].path.values
/Users/thomasbazeille/Documents/Stage/fmralign/examples/plot_pairwise_alignment.py:65: UserWarning: Boolean Series key will be reindexed to match DataFrame index.
  target_train = df[df.subject == 'sub-02'][df.acquisition == 'ap'].path.values
/Users/thomasbazeille/Documents/Stage/fmralign/examples/plot_pairwise_alignment.py:73: UserWarning: Boolean Series key will be reindexed to match DataFrame index.
  source_test = df[df.subject == 'sub-01'][df.acquisition == 'pa'].path.values
/Users/thomasbazeille/Documents/Stage/fmralign/examples/plot_pairwise_alignment.py:74: UserWarning: Boolean Series key will be reindexed to match DataFrame index.
  target_test = df[df.subject == 'sub-02'][df.acquisition == 'pa'].path.values
Define the estimator, fit it and predict
To proceed with alignment we use PairwiseAlignment class. We will use the common model proposed in the literature: * we will align the whole brain through multiple local alignments. * these alignments are calculated on a parcellation of the brain in 150
pieces, this parcellation creates group of functionnally similar voxels.
from fmralign.pairwise_alignment import PairwiseAlignment
alignement_estimator = PairwiseAlignment(
    alignment_method='scaled_orthogonal', n_pieces=150, mask=masker)
# Learn alignment operator from subject 1 to subject 2 on training data
alignement_estimator.fit(source_train, target_train)
# Predict test data for subject 2 from subject 1
target_pred = alignement_estimator.transform(source_test)
Out:
/Users/thomasbazeille/anaconda2/envs/py36/lib/python3.6/site-packages/nilearn/input_data/masker_validation.py:74: UserWarning: Overriding provided-default estimator parameters with provided masker parameters :
Parameter standardize :
    Masker parameter False - overriding estimator parameter None

  warnings.warn(warn_str)
/Users/thomasbazeille/anaconda2/envs/py36/lib/python3.6/site-packages/nilearn/input_data/masker_validation.py:74: UserWarning: Overriding provided-default estimator parameters with provided masker parameters :
Parameter mask_strategy :
    Masker parameter background - overriding estimator parameter epi
Parameter smoothing_fwhm :
    Masker parameter None - overriding estimator parameter 4.0

  warnings.warn(warn_str)
- Score the baseline and the prediction
- We use a utility scoring function to measure the voxelwise correlation between
the prediction and the ground truth. That is, for each voxel, we measure the correlation between its profile of activation without and with alignment, to see if alignment was able to predict a signal more alike the ground truth.
from fmralign._utils import voxelwise_correlation

# Now we use this scoring function to compare the correlation of aligned and
# original data from sub-01 made with the real PA contrasts of sub-02.

baseline_score = voxelwise_correlation(
    target_test, source_test, masker)
aligned_score = voxelwise_correlation(
    target_test, target_pred, masker)
- Plotting the measures
Finally we plot both scores
from nilearn import plotting
baseline_display = plotting.plot_stat_map(
    baseline_score, display_mode="z", vmax=1, cut_coords=[-15, -5])
baseline_display.title("Baseline correlation wt ground truth")
display = plotting.plot_stat_map(
    aligned_score, display_mode="z", cut_coords=[-15, -5], vmax=1)
display.title("Prediction correlation wt ground truth")
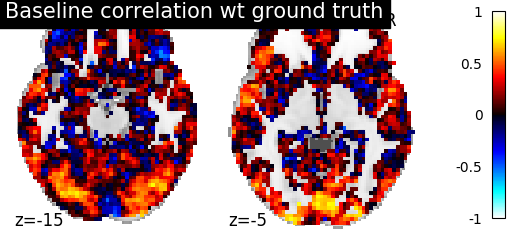
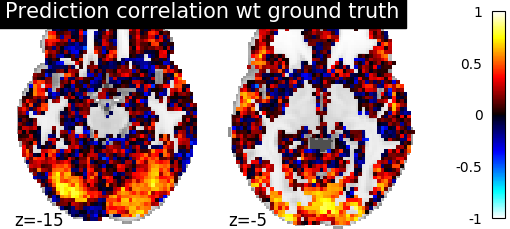
We can see on the plot that after alignment the prediction made for one subject data, informed by another subject are greatly improved.
Total running time of the script: ( 0 minutes 21.241 seconds)